Environmental Performance Data
Company Report
Our Company reports environmental activity of all manufacturing sites in FY2023.
◆Data on this report covers the term of April 1, 2023 to March 31, 2024, based on the organization as of March 31, 2024.
CO2 Reduction
| Results | Previous fiscal year result | |
|---|---|---|---|
| Global | (Japan) |
|
CO2 emission [t] | 542,420 | 229,001 | 547,949 |
Water
| Results | Previous fiscal year result | |
|---|---|---|---|
| Global | (Japan) |
|
Water consumption *1 [ 1000m3 ] | 5,410 | 4,102 | 5,866 |
Reduction amount of water consumption [ 1000m3 ] | 456 | 379 | |
Reduction rate[ % ] | 8% | 9% |
|
*1 Personal water consumption is not included.
Water consumption were reduced by approx. 8% globally in fiscal year 2023 (compared to the previous fiscal year).
Chemical Substances
Panasonic Group makes efforts to reduce released and transferred amount of chemical substances, which cause impact on environment, with the original index, Human and Environment Impact (Sustainability Data Book 2024, pages 66 to 68).
| Results | Previous fiscal year result | |
|---|---|---|---|
| Global | (Japan) |
|
Human and Enviroment Impact | 125,453 | 79,980 | 127,046 |
We are promoting Human and Enviroment Impact reduction activities optimized for characteristics of each manufacturing process.
Material Balance of Factory Chemical Substances
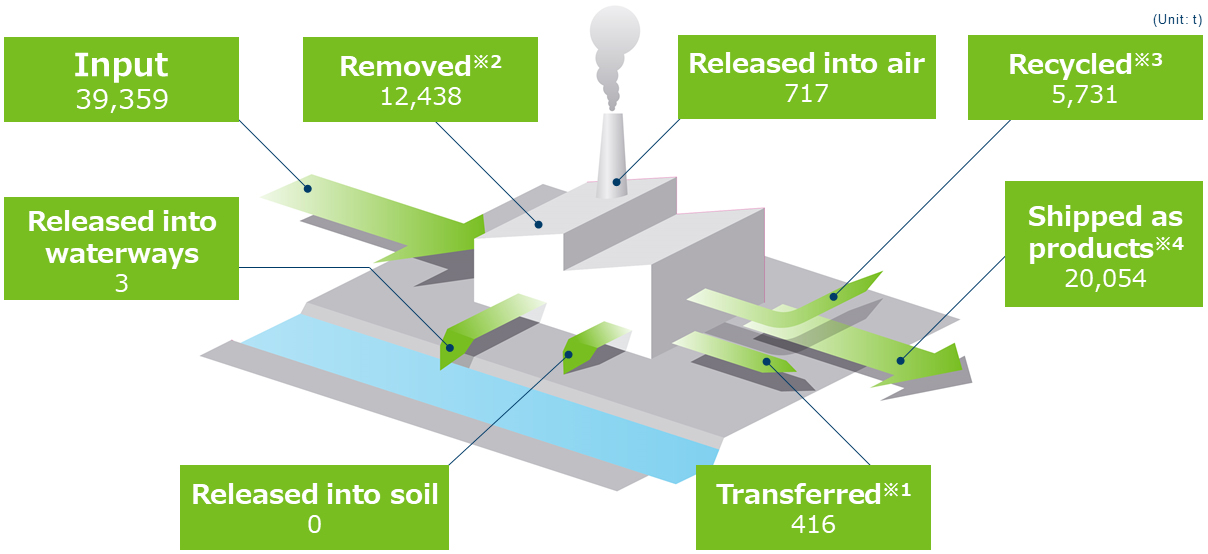
※1 Includes substances transferred as waste, as well as those discharged into the sewage system. Recycled amount which is free of charge or accompanies treatment cost under the Waste Management Law is included in “Recycled.” (Different from the transferred amount reported under the PRTR Law.)
※2 The amount of substances converted into other substances through neutralization, decomposition, or other chemical treatment.
※3 The amount of substances recycled with revenue, as well as those recycled free of charge or with any payment.
※4 The amount of substances that have been changed to other substances as a result of chemical reactions, and/or those that are contained in or accompanied with products and shipped out of factories.
Wastes and Valuables
| Results | Target | |
|---|---|---|---|
| Global | (Japan) |
|
Recycled amount [t] | 66,635 | 31,447 |
|
Final disposal amount [t] | 481 | 22 | |
Factory waste recycling rate*4 [%] | 99.3% | 99.9% |
|
*4 Factory waste recycling rate = Amount of resources recycled / (Amount of resources recycled + Amount of landfill)
We achieved the target of factory waste recycling rate by promoting effective use of resources.
* Above data on this report are rounded off to integers (factory waste recycling rates are rounded second decimal place).